Overall progress in management effectiveness for protected areas in PNG (refer to page 10)
Overall progress in management effectiveness for protected areas in PNG
Map with existing and proposed protected areas in PNG. Status on August 2017. Produced by CEPA.
Map showing the PNG roads 2014 - Open Street Map dataset and the PNG roads 2000 - National Mapping Bureau dataset.
Map showing tree cover gain (2001-2012) and tree cover loss (2001-2017) in PNG.
Screenshot from the Interactive Map on the Global Forest Watch website.
Link to download a zip file containing OSM spatial files, a QGIS project, styles, license file and documentation on how to get started.
This dataset contains mapped point locations for protected areas within Papua New Guinea. This dataset should be viewed in combination with the World Database on Protected Areas polygon locations to get a comprehensive view of all protected areas within Papua New Guinea.
This dataset contains mapped polygon locations for protected areas within Papua New Guinea. This dataset should be viewed in combination with the World Database on Protected Areas point locations to get a comprehensive view of all protected areas within Papua New Guinea.
Resource contains raster files for a Digital Elevation Model (DEM) and derived hillshade for Papua New Guinea.
The ASTER Global Digital Elevation Model (GDEM) Version 3 (ASTGTM) provides a global digital elevation model (DEM) of land areas on Earth at a spatial resolution of 1 arc second (approximately 30 meter horizontal posting at the equator).
This resource contains 30-meter resolution satellite imagery for Papua New Guinea. The imagery was collected during the years 2018-2020 from the Landsat-8 satellite. Images were selected for their visibility, however there is cloud cover present in the final images due to the size of Papua New Guinea and availability of datasets. This imagery should be used for guidance only and cited as "Landsat-8 image courtesy of the U.S. Geological Survey" if used in any presentations or other work.
The Papua New Guinea National Action Plan was initiated and developed for a 10 year timeframe through a series of stakeholder consultations and workshops in 2012, and this process further continued in 2017. The main underlying focus of the National Action Plan is on the wise application and development of integrated and sustainable land management approaches and practices.
"The Papua New Guinea agricultural sector transformed by innovative information and communication
technologies, by 2023”.
Mean, maximum, minimum, monthly, and deity peak or lowest peak for water discharge by rivers and creeks in cubic metres per seconds (m3/s) in PNG between 1952 and 1964. Adapted from Commonwealth of Australia, Department at Works (CADoW) (1967) 0 = insufficient data. Data extracted from PNG SOE Report (page 198). Note: converted from pdf to excel format.
Map of the protected areas for Papua New Guinea with country-level summary statistics on the amount of area under protection, count for each type of protected area (terrestrial or marine), and the count of their designation.
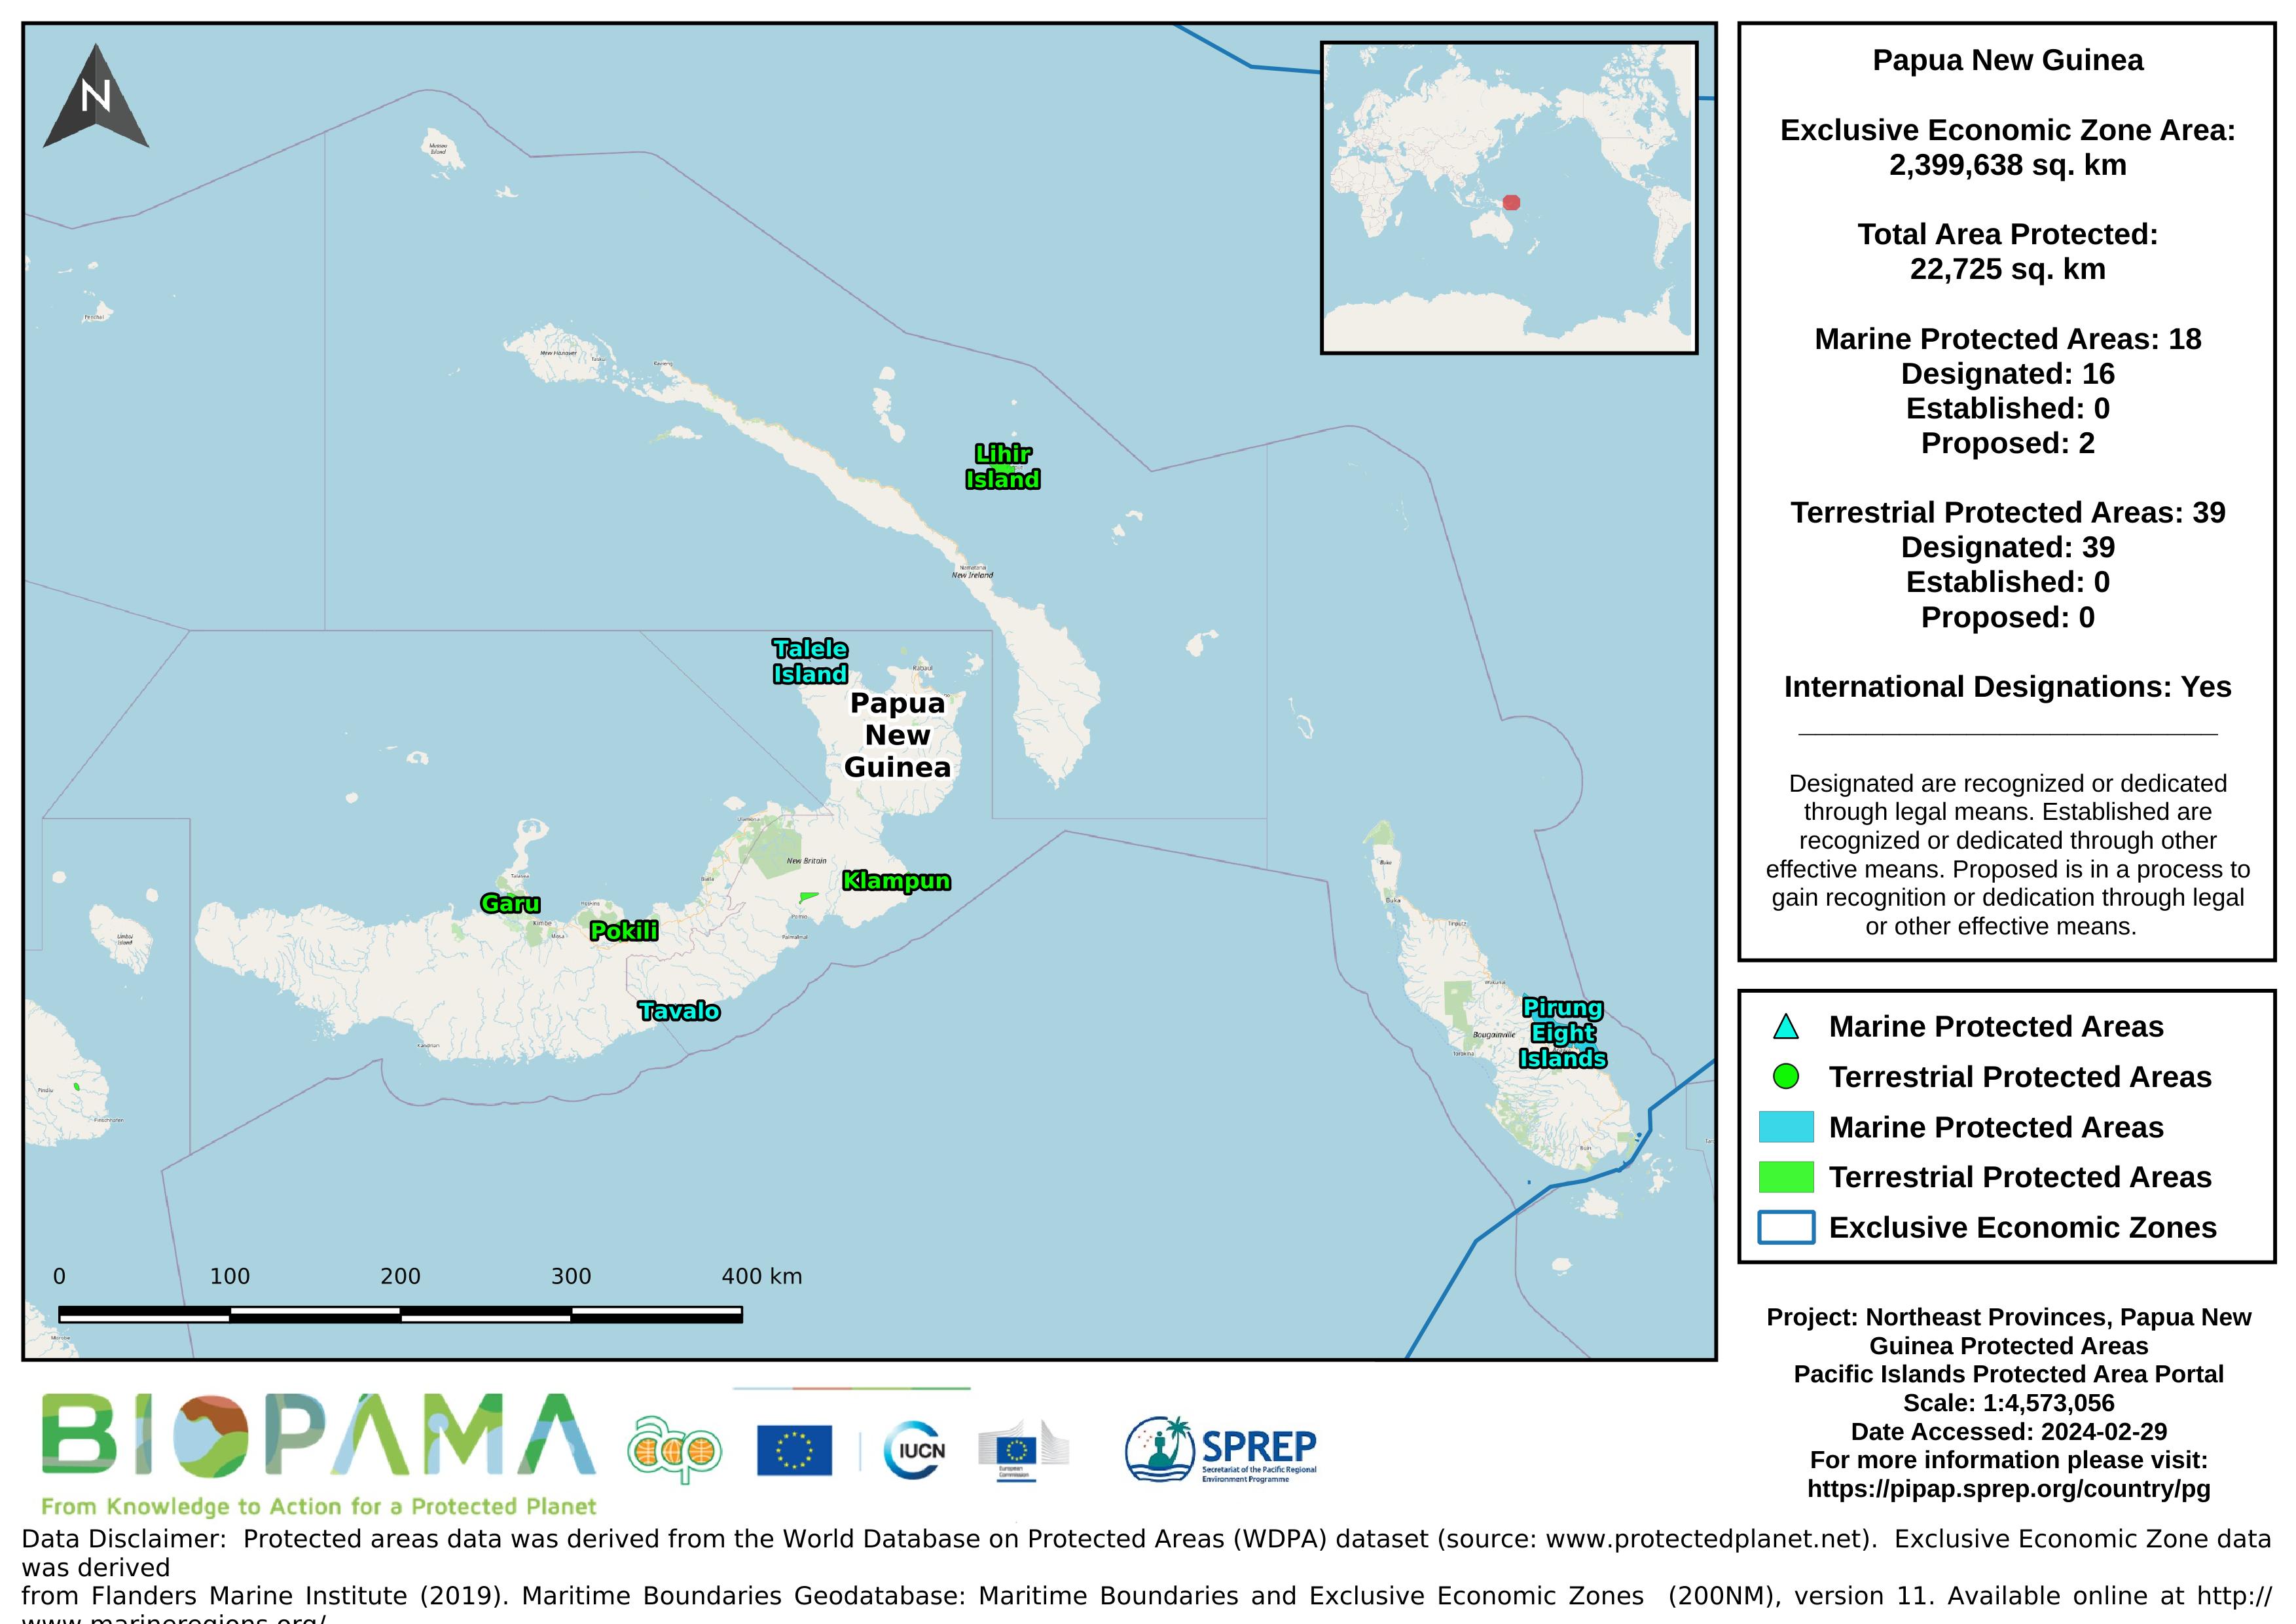
Map of the protected areas for the northeast provinces of Papua New Guinea with country-level summary statistics on the amount of area under protection, count for each type of protected area (terrestrial or marine), and the count of their designation.
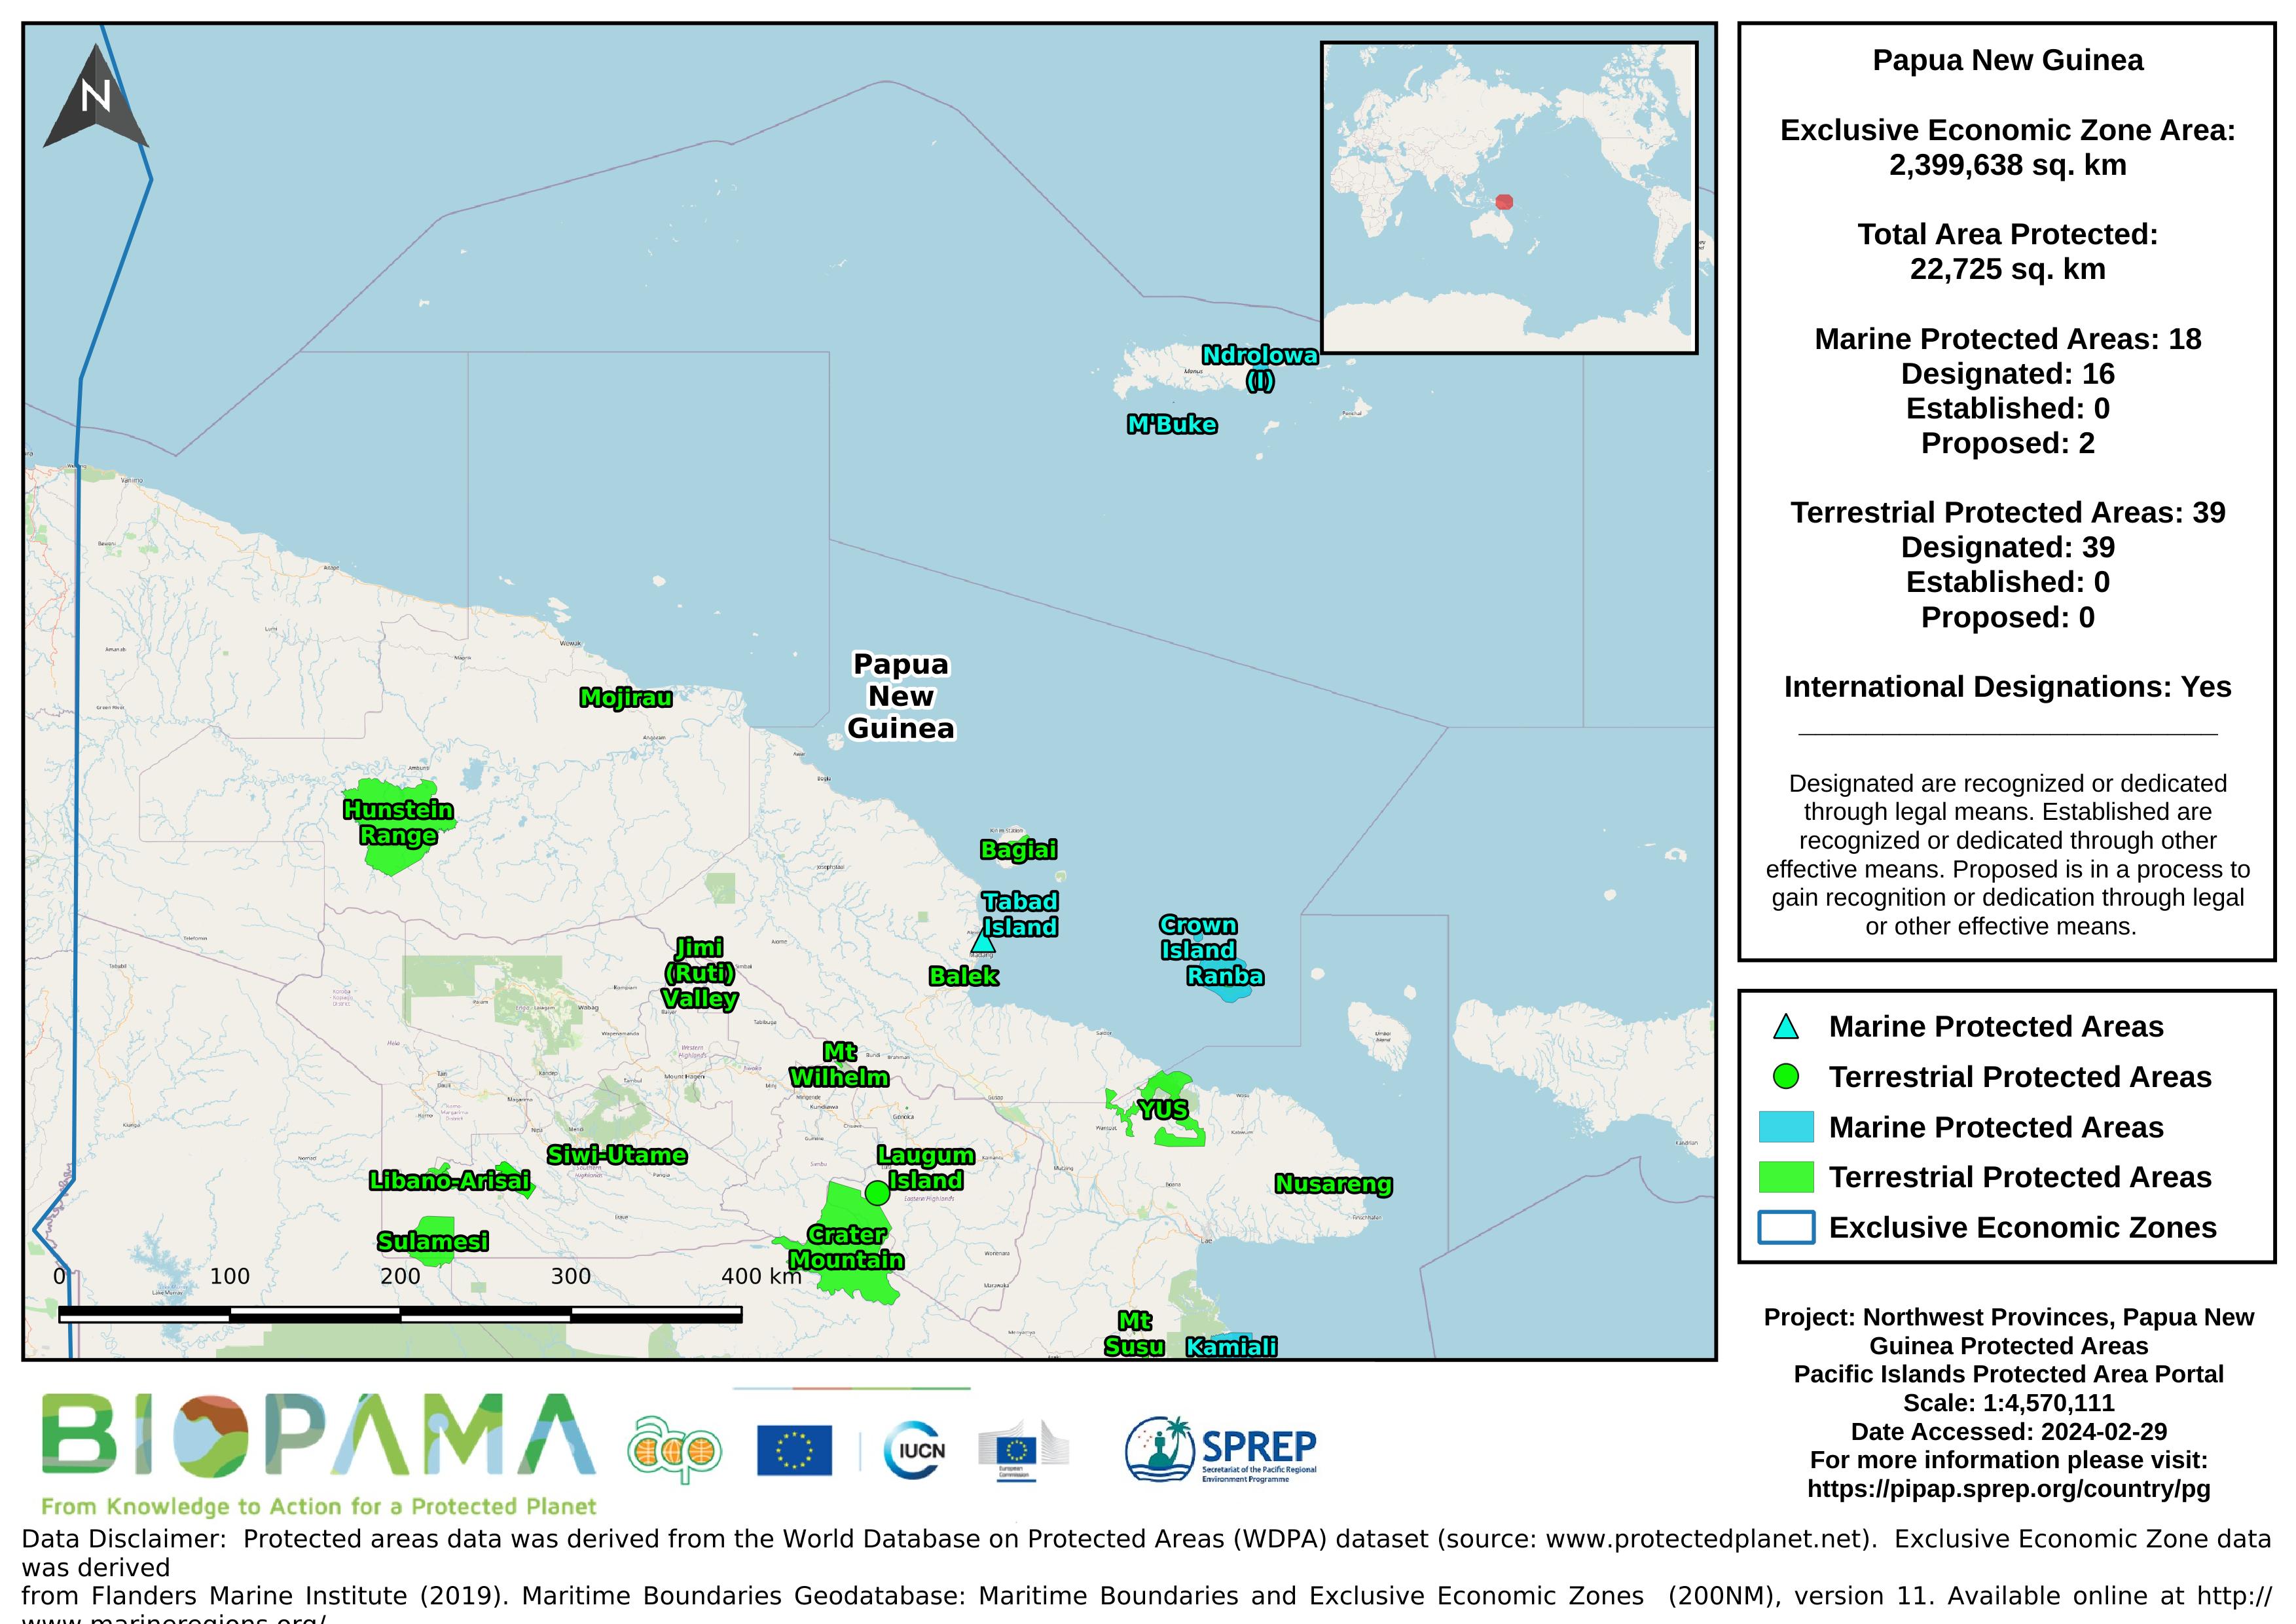
Map of the protected areas for the northwest provinces of Papua New Guinea with country-level summary statistics on the amount of area under protection, count for each type of protected area (terrestrial or marine), and the count of their designation.